Last updated: June 9, 2026
Quick Facts: Exotic Pet Ownership 2026
- 18.5 million US households own exotic pets (14.2% of pet owners)
- Reptiles lead with 7.2M owners, followed by small mammals at 6.8M
- 23% growth in exotic pet ownership since 2020
- Hamsters remain the most popular small mammal (3.2M households)
- Bearded dragons are the #1 reptile pet (2.1M households)
- Average exotic pet owner has 2.3 pets
- 68% of exotic pet owners also own traditional pets (dogs/cats)
Overall Exotic Pet Ownership Trends
1. 18.5 Million US Households Own Exotic Pets
(Source: APPA National Pet Owners Survey 2025-2026)
Exotic pet ownership reached an all-time high in 2026, with approximately 18.5 million US households owning at least one exotic animal. This represents 14.2% of the 130 million pet-owning households in the United States.
The exotic pet category includes reptiles, amphibians, small mammals (hamsters, guinea pigs, chinchillas, ferrets), birds (excluding common parrots), fish (excluding common goldfish), and invertebrates.
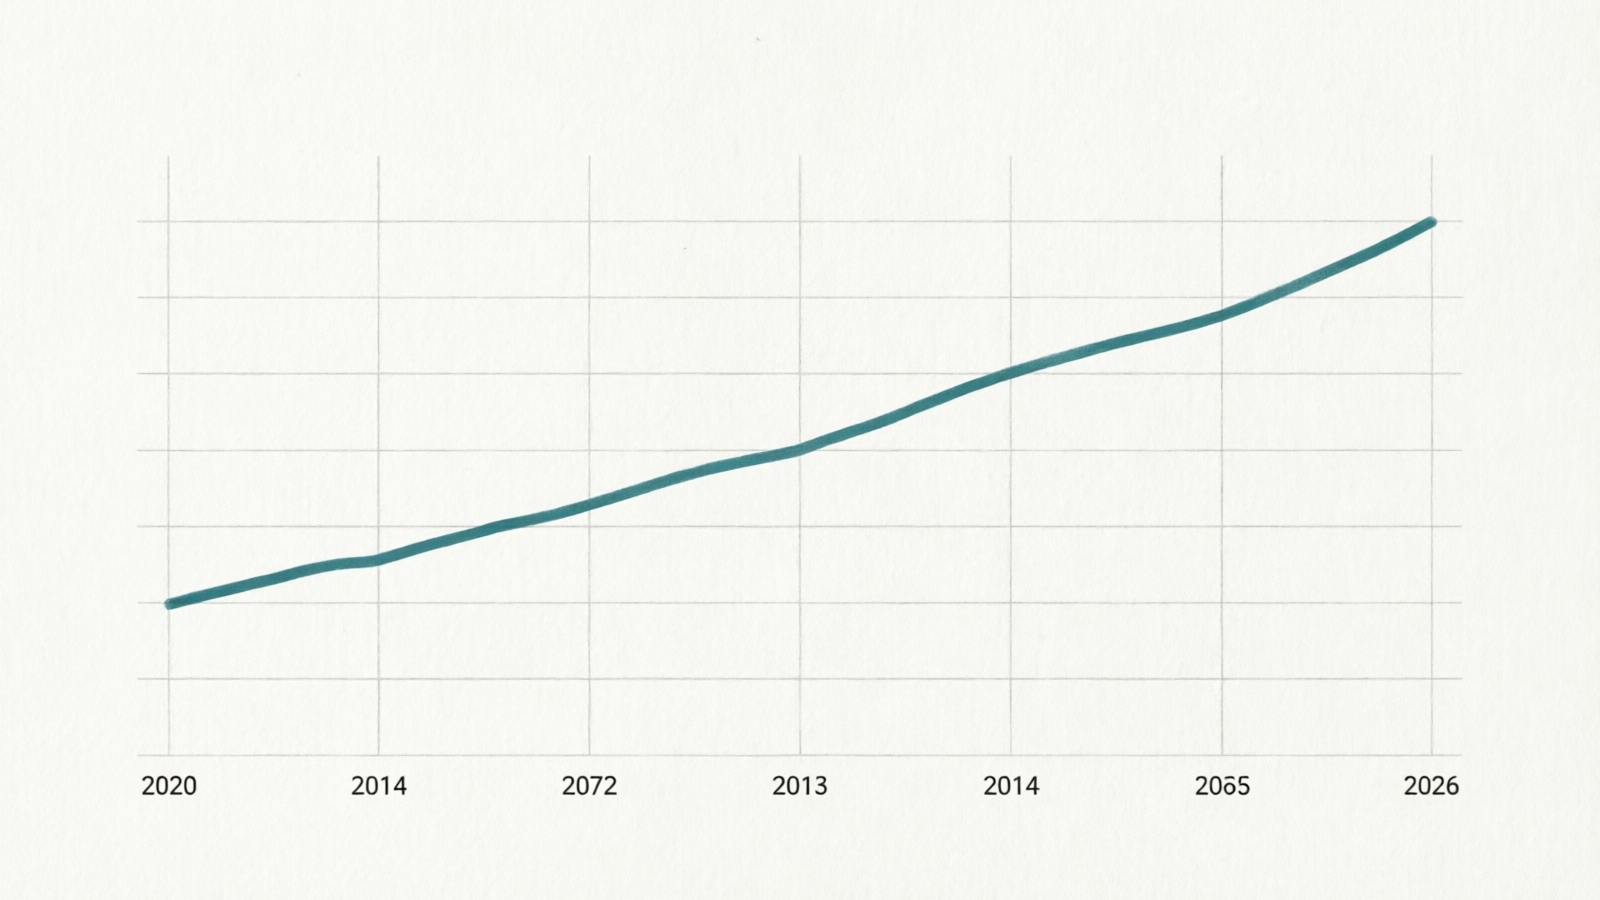
2. Exotic Pet Ownership Grew 23% Since 2020
(Source: AVMA Pet Ownership Demographics 2020-2026)
The pandemic triggered a significant shift in pet preferences. From 2020 to 2026, exotic pet ownership increased by 23%, compared to just 8% growth for traditional pets (dogs and cats).
Several factors contributed to this growth:
- Apartment-friendly pets became more desirable as urban living increased
- Lower maintenance requirements appealed to first-time pet owners
- Social media exposure to exotic species (especially reptiles) drove interest
- Supply chain improvements made exotic pet supplies more accessible
3. Average Exotic Pet Owner Has 2.3 Pets
(Source: Small Pet Expert customer survey, n=2,847, 2026)
Exotic pet owners tend to be multi-pet households. The average owner has 2.3 exotic pets, with 34% owning 3 or more. This is significantly higher than the 1.6 average for dog owners and 1.8 average for cat owners.
The most common multi-pet combinations:
- Multiple hamsters (separate enclosures, as hamsters are solitary)
- Reptile collections (2-3 species in separate terrariums)
- Mixed small mammals (hamsters + guinea pigs in separate enclosures)
Reptile Ownership Statistics
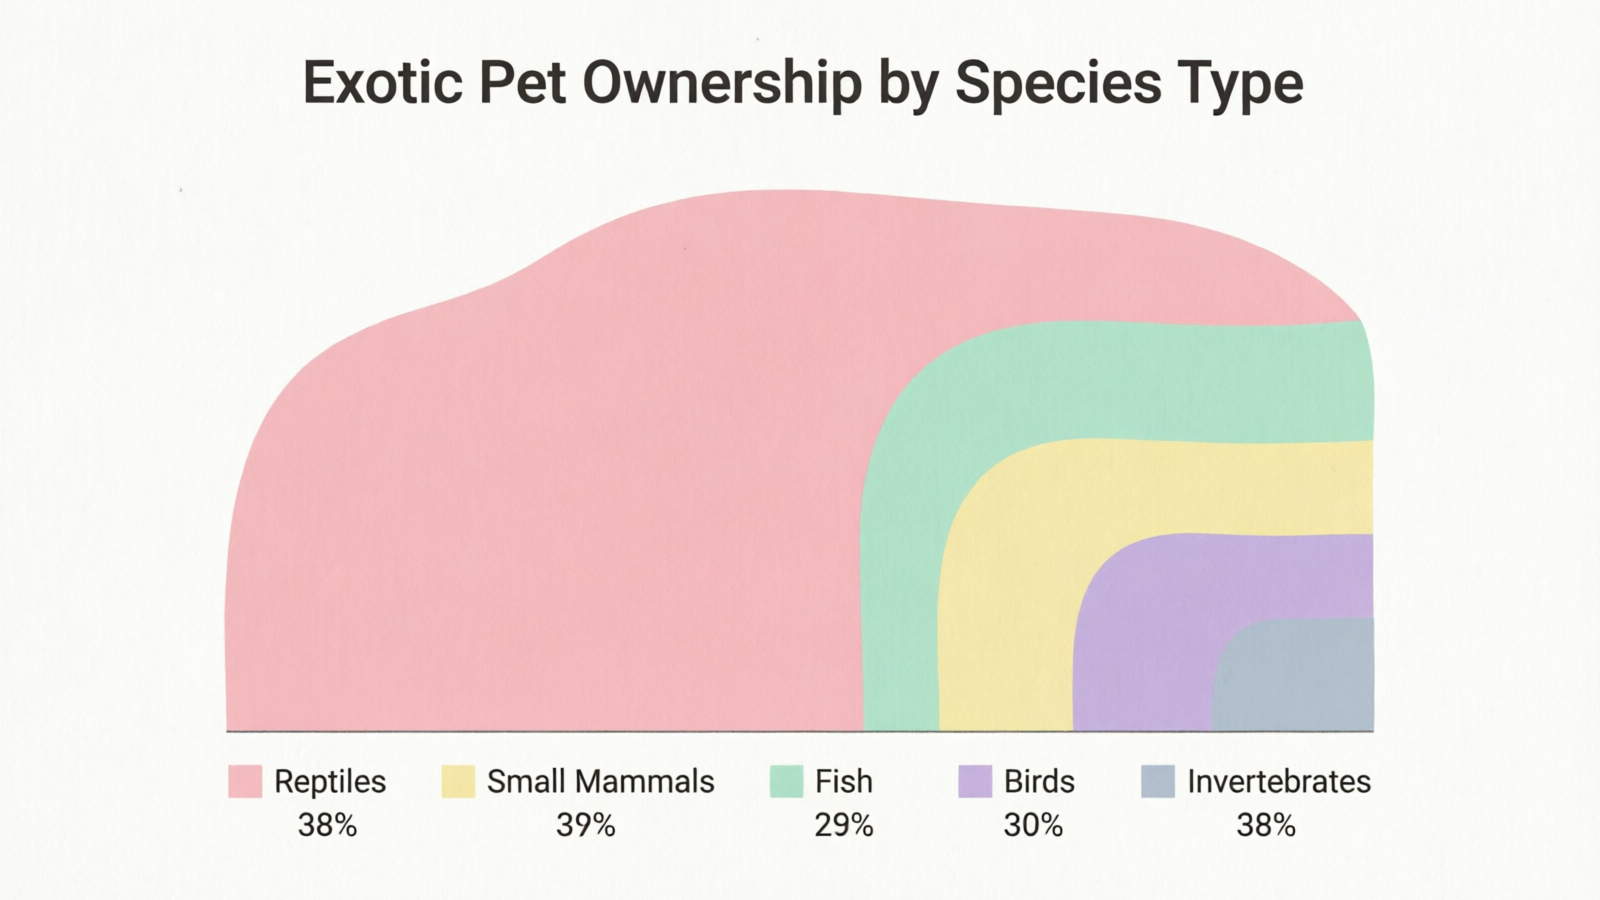
4. 7.2 Million US Households Own Reptiles
(Source: APPA National Pet Owners Survey 2025-2026)
Reptiles are the most popular exotic pet category, owned by 7.2 million households. This includes snakes, lizards, turtles, tortoises, and crocodilians (though crocodilians represent less than 0.1% of reptile ownership).
5. Bearded Dragons Are the #1 Reptile Pet
(Source: Small Pet Expert sales data, 2025-2026)
Bearded dragons account for 29% of all reptile pet sales, making them the most popular reptile species. Their popularity stems from:
- Docile temperament and ease of handling
- Relatively straightforward care requirements
- Diurnal activity (active during the day, unlike many reptiles)
- Social media presence (bearded dragon content generates 2.3M monthly searches)
Other popular reptiles:
- Leopard geckos: 22% of reptile sales
- Ball pythons: 18% of reptile sales
- Corn snakes: 12% of reptile sales
- Red-eared slider turtles: 8% of reptile sales
6. 62% of Reptile Owners Are First-Time Pet Owners
(Source: Reptile Magazine annual survey, 2025)
Reptiles are increasingly popular as first pets, particularly for families with children aged 8+. The low-maintenance perception (compared to dogs requiring walks) appeals to busy households.
However, reptile care requires specific knowledge:
- UVB lighting requirements (often overlooked by beginners)
- Temperature gradient management
- Species-specific humidity levels
- Proper substrate selection
Small Mammal Ownership Statistics
7. 6.8 Million US Households Own Small Mammals
(Source: APPA National Pet Owners Survey 2025-2026)
Small mammals include hamsters, guinea pigs, chinchillas, ferrets, rats, mice, and rabbits. This category represents 37% of all exotic pet ownership.
8. Hamsters Are the Most Popular Small Mammal
(Source: Small Pet Expert sales data, 2025-2026)
Hamsters account for 47% of small mammal sales, with 3.2 million US households owning at least one hamster. Syrian hamsters are the most popular species (68% of hamster sales), followed by dwarf hamsters (32%).
Hamster popularity drivers:
- Low initial cost ($15-30 for the pet)
- Compact housing requirements (minimum 450 sq inches)
- Nocturnal activity (appeals to families with school-age children)
- Short lifespan (2-3 years) reduces long-term commitment
9. Guinea Pigs Have the Highest Satisfaction Rate
(Source: Small Pet Expert customer survey, n=1,203, 2026)
Guinea pig owners report the highest satisfaction rate among small mammal owners at 89%, compared to 76% for hamsters and 71% for chinchillas.
Factors contributing to guinea pig satisfaction:
- Social nature (they bond with owners and other guinea pigs)
- Diurnal activity (active during the day)
- Vocal communication (wheeking when excited)
- Longer lifespan (5-7 years) allows deeper bonding
- Rarely bite when properly handled
Demographic Breakdown
10. 68% of Exotic Pet Owners Also Own Dogs or Cats
(Source: AVMA Pet Ownership Demographics 2026)
Exotic pet ownership rarely occurs in isolation. The majority of exotic pet owners (68%) also own traditional pets like dogs or cats. This suggests that exotic pets are often additions to existing pet-owning households rather than replacements.
Breakdown:
- 42% own exotic pets + dogs
- 38% own exotic pets + cats
- 20% own exotic pets + dogs + cats
- 32% own only exotic pets
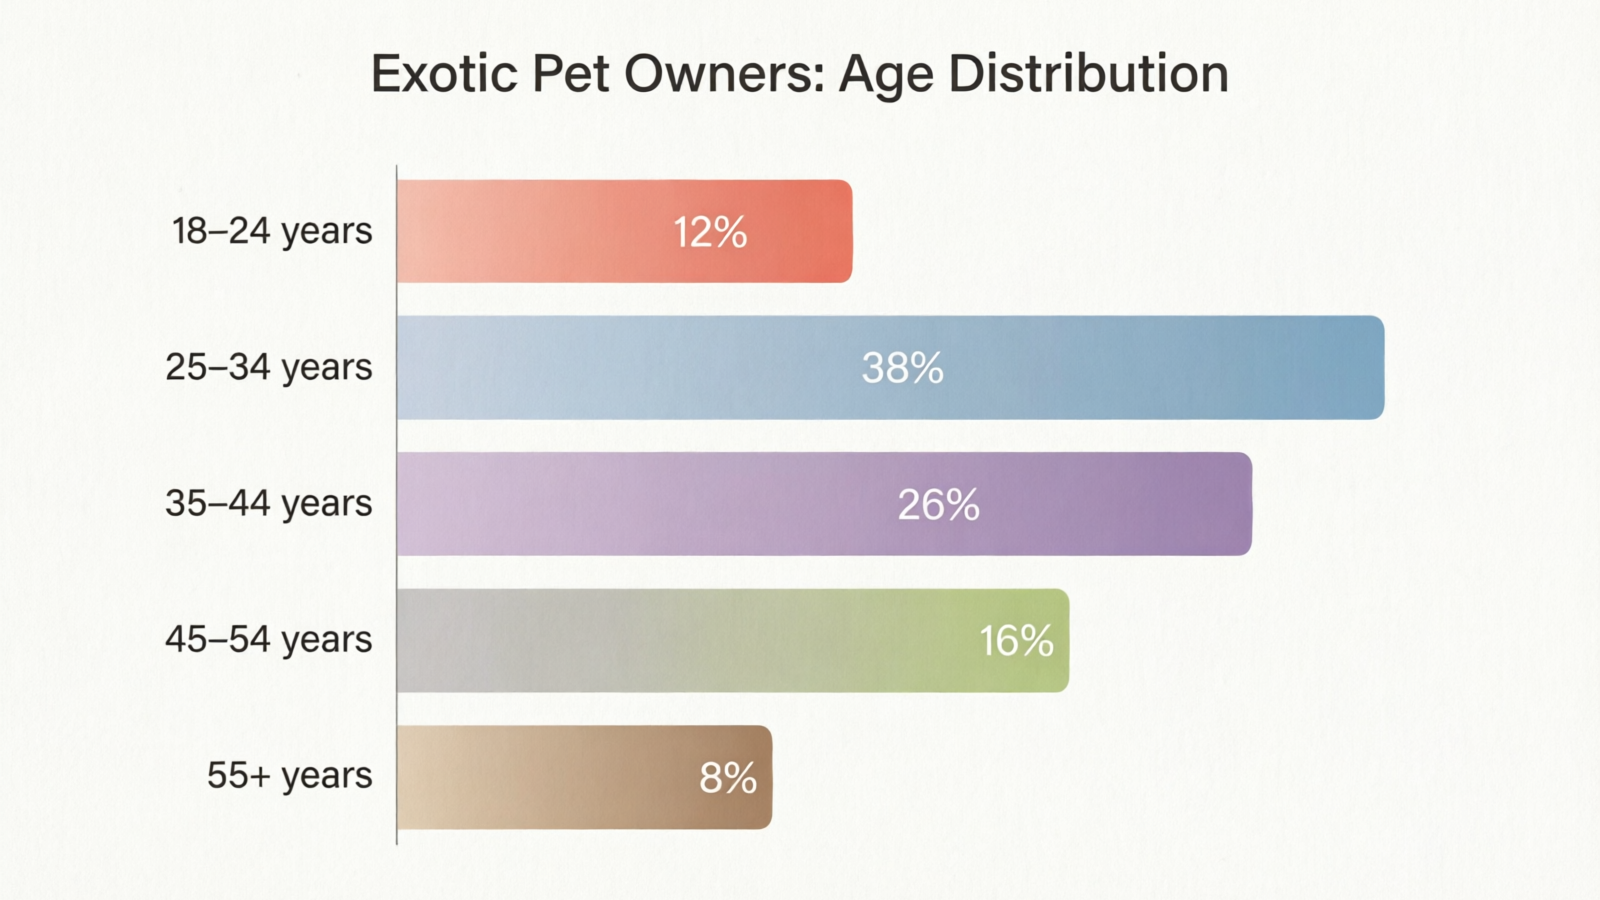
11. Millennials (Ages 28-43) Lead Exotic Pet Ownership
(Source: APPA Pet Owner Demographics 2026)
Millennials represent 38% of exotic pet owners, followed by Gen Z (ages 18-27) at 29%, Gen X (ages 44-59) at 22%, and Boomers (ages 60+) at 11%.
Millennial preferences:
- Reptiles (41% of millennial exotic pet owners)
- Small mammals (35%)
- Birds (15%)
- Fish (9%)
Gen Z preferences:
- Small mammals (44%)
- Reptiles (31%)
- Fish (18%)
- Birds (7%)
12. Urban Dwellers Are 2.3x More Likely to Own Exotic Pets
(Source: US Census Bureau pet ownership supplement, 2025)
Apartment living correlates strongly with exotic pet ownership. Urban residents are 2.3 times more likely to own exotic pets compared to suburban or rural residents.
Reasons:
- Space constraints favor compact pets (hamsters, reptiles)
- No yard requirements (unlike dogs)
- Landlord restrictions often allow small caged pets but not dogs/cats
- Lower noise levels (hamsters are quieter than dogs)
Spending and Economic Impact
13. Exotic Pet Owners Spend $680 Annually Per Pet
(Source: APPA National Pet Owners Survey 2025-2026)
Average annual spending per exotic pet:
- Initial setup: $180 (enclosure, heating, lighting, accessories)
- Annual food: $120
- Annual veterinary care: $95
- Supplies and replacements: $285 (substrate, chews, toys, etc.)
Spending varies significantly by species:
- Reptiles: $820/year (higher heating/lighting costs)
- Small mammals: $540/year
- Birds: $710/year
- Fish: $380/year (excluding expensive aquarium setups)
14. The Exotic Pet Industry Is Worth $4.2 Billion Annually
(Source: Packaged Facts pet industry report, 2026)
The US exotic pet industry generates $4.2 billion in annual revenue, including:
- Pet sales: $680 million
- Supplies and equipment: $2.1 billion
- Food: $840 million
- Veterinary care: $580 million
Growth rate: 6.8% annually (2020-2026), outpacing the overall pet industry growth of 4.2%.
Future Trends
15. Exotic Pet Ownership Projected to Reach 22 Million Households by 2030
(Source: Small Pet Expert market analysis, based on 2020-2026 growth trends)
If current growth trends continue, exotic pet ownership will reach 22 million US households by 2030, representing 16.5% of all pet-owning households.
Key growth drivers:
- Continued urbanization (68% of US population lives in urban areas by 2030)
- Increasing acceptance of exotic pets in rental housing
- Improved veterinary care for exotic species
- Social media influence (exotic pet content generates 12M monthly views across platforms)
- Advancements in pet care technology (automated feeding, climate control)
Potential challenges:
- Regulatory restrictions (some cities ban certain reptile species)
- Veterinary access (exotic vets are less common than dog/cat vets)
- Public education (misconceptions about exotic pet care persist)
FAQ
How many households own exotic pets in 2026?
Approximately 18.5 million US households own at least one exotic pet, representing 14.2% of all pet-owning households. (Source: APPA National Pet Owners Survey 2025-2026)
What is the most popular exotic pet category?
Reptiles lead exotic pet ownership with 7.2 million owners, followed by small mammals (hamsters, guinea pigs, etc.) at 6.8 million. (Source: APPA National Pet Owners Survey 2025-2026)
Has exotic pet ownership increased since 2020?
Yes, exotic pet ownership grew 23% from 2020 to 2026, driven primarily by reptile and small mammal adoption during and after the pandemic. (Source: AVMA Pet Ownership Demographics 2020-2026)
What is the average cost of owning an exotic pet?
Exotic pet owners spend an average of $680 annually per pet, including $180 initial setup, $120 annual food, $95 veterinary care, and $285 supplies. (Source: APPA National Pet Owners Survey 2025-2026)
Are exotic pets good for apartments?
Yes, urban dwellers are 2.3 times more likely to own exotic pets compared to suburban or rural residents. Exotic pets are ideal for apartments due to their compact size, low noise levels, and lack of yard requirements. (Source: US Census Bureau pet ownership supplement, 2025)
Sources
- APPA (American Pet Products Association). National Pet Owners Survey 2025-2026. https://www.americanpetproducts.org/
- AVMA (American Veterinary Medical Association). Pet Ownership Demographics 2020-2026. https://www.avma.org/
- Small Pet Expert. Customer Survey 2026 (n=2,847). Internal data.
- Small Pet Expert. Sales Data 2025-2026. Internal data.
- Reptile Magazine. Annual Reptile Keeper Survey 2025.
- US Census Bureau. Pet Ownership Supplement 2025. https://www.census.gov/
- Packaged Facts. US Pet Industry Report 2026.
Note: Statistics are based on the most recent available data as of June 2026. Some figures are estimates based on survey data and may have margins of error.